Data that guides, not distracts.
CatchUp24 gathers metrics from voice, messaging, and booking: demand, conversions, appointments, and revenue — so you know what to optimize without living in charts.
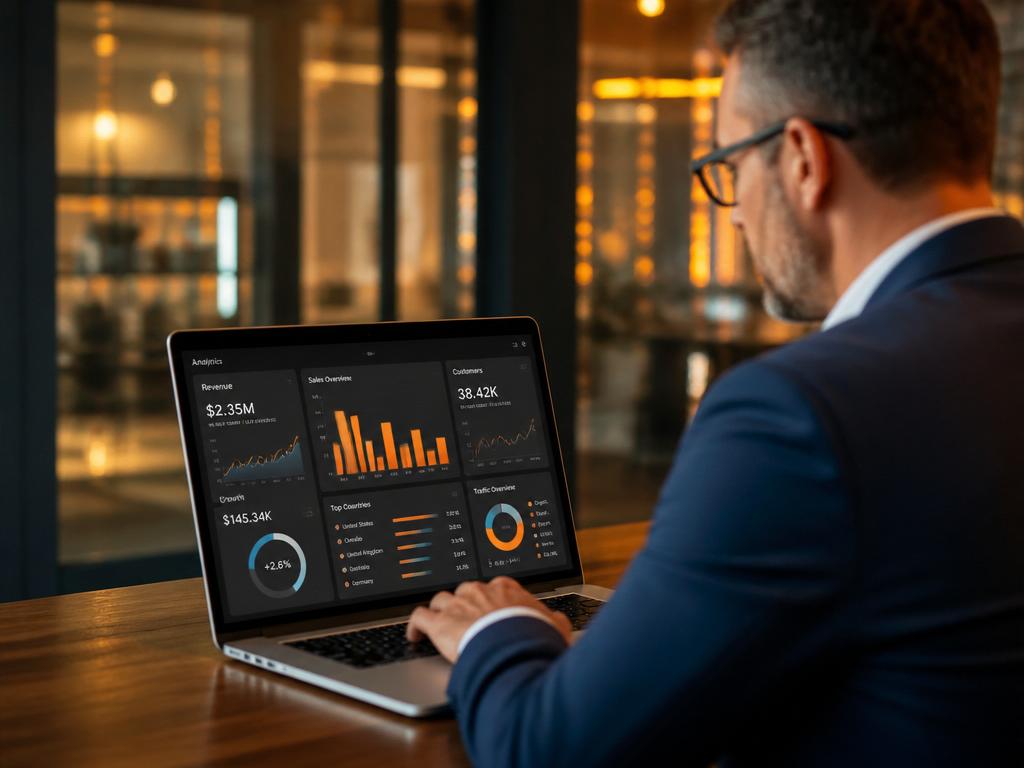
Most analytics give you charts. You want decisions.
Too many tools leave you with open tabs and no clear action. CatchUp24 connects operational data — request volume, conversation outcomes, bookings created, average value — in a view built for service businesses.
The data exists so you and the system understand what works: which time bands convert, where requests are lost, how much upsell is worth.
The full path, from contact to revenue.
Metrics come from Voice Agent, Messaging, Smart Booking, and Customer Intelligence. One thread: request → conversation → booking → value.
You use the numbers to tune hours, offers, and rules — with evidence, not gut feel.
Visible demand
Call and message volumes by time band and channel.
Real conversion
How many requests become confirmed bookings.
Revenue impact
Average value, add-ons, and calendar fill linked to conversations.
Performance you can use.
Volume by channel
Monitor phone, web, email, and social in one place.
Booking rate
See where conversations close — and where they do not.
Revenue performance
Connect handled requests to booked value and upsell.
Demand patterns
Spot peaks, gaps, and bands to promote or reinforce.
Conversation quality
Use transcripts and outcomes to improve prompts and rules.
Operational decisions
Act on hours, staffing, and offers with fresh data.
Data starts on day one.
As CatchUp24 answers and books, metrics populate. You read what matters and optimize with clarity.